Illinois monthly recreational sales bounce back
Illinois Department of Financial and Professional Regulation announced Illinois’ March 2022 recreational sales totals today. Illinois’ March cannabis sales total of $130,960,120.66 was the second-highest monthly total since legalization. The only monthly sales total more than last month was Decembers’ 2021 total of $137,896,859.11.
The in-state March resident sales total increased to $90,391,353.23 and was also the second highest since legalization in Illinois. The only resident sales total more than last month was December 2021 totals of $95,634,565.57.
The out-of-state resident sales totals increased to $40,568.767.43 in March for the fifth highest since legalization. Total items sold in March reached 3,007,699, the most since December2021 at 3,180,944.

In 2021, Illinois totaled $1,379,088,278.61 for the year, which more than doubled 2020 totals of $669,084,410.12. Find all monthly totals below.
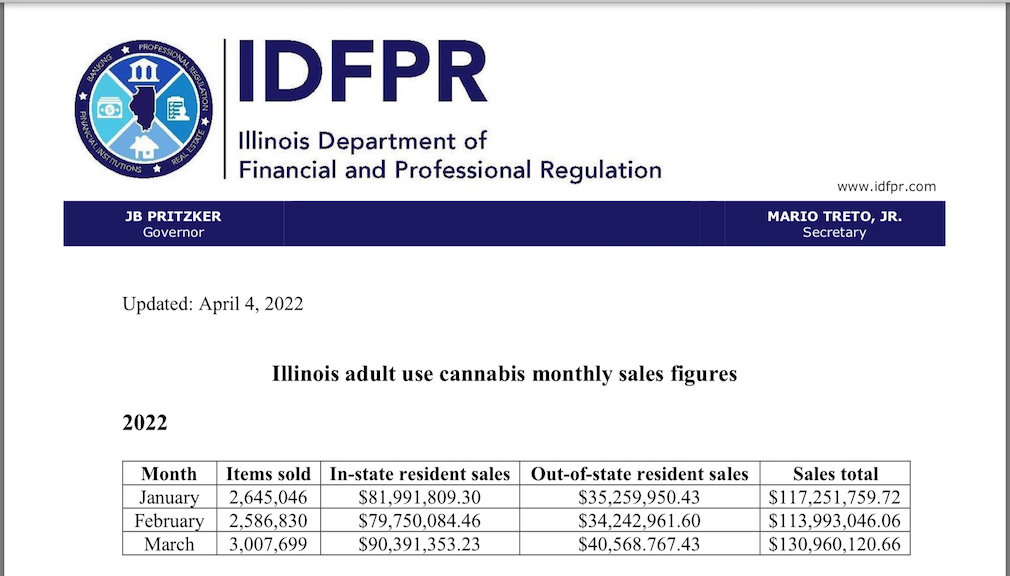
2022 total monthly sales include:
January: $117,251,759.72
February: $113,993,046.06
March: $130,960,120.66

2021 total monthly sales include:
January: $88,813,872.78
February: $80,741,641.84
March: $109,149,355.98
April: $114,961,668.22
May: $116,380,348.01
June: $115,574,741.27
July: $127,794,220.50
August: $121,933,542.23
September: $121,717,709.51
October: $123,375,372.44
November: $120,748,946.72
December: $137,896,859.11
Year totals: $1,379,088,278.61

The recreational cannabis sales for 2020 totals included:
January: $39,247,840.83
February: $34,805,072.01
March: $35,902,543.22
April: $37,260,497.89
May: $44,317,385.72
June: $47,646,437.25
July: $60,956,981.41
August: $63,963,846.90
September: $67,648,362.14
October: $75,278,200.15
November: $75,199,344.33
December: $86,857,898.27
Totals: $669,084,410.12
These figures do not include taxes collected. For more Illinois cannabis industry news, click here.

To learn more about cannabis-friendly events in Illinois, click here.